Kandidáti · Demokratická strana
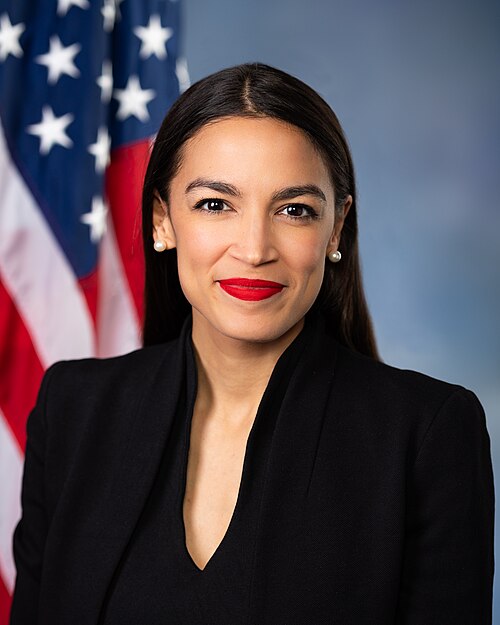
Alexandria Ocasio-Cortez
Foto: Franmarie Metzler; U.S. House Office of Photography · Public domain

Alexandria Ocasio-Cortez

Demokratická strana · U.S. Representative, New York

Nerozhodla sa3. z 26 demokratovnar. 1989

  1. 2019 House, New York
Porovnať s ostatnými

šanca na nomináciu

12 %

▲ 4 p. b. za 2 týždne

Priemer prieskumov13 %z 7 prieskumov
Najlepší / najhorší prieskum17,9 / 5 %za posledných 6 mesiacov · čiarka = priemer
Odstup od Harris−9 p. b.v priemere prieskumov

Kandidatúra 2028: Nerozhodla sa

Nevylučuje kandidatúru na prezidentku ani do Senátu za New York.

Zdroj: NBC News (9. 8. 2026)

Vývoj v čase

Šanca na nomináciu

12 %bez zmeny

0 %10 %20 %5. 11. 20267. 11. 202610. 11. 202613. 11. 202616. 11. 20260 %10 %20 %5. 11. 202610. 11. 202616. 11. 2026

Model sa prepočítava raz týždenne.

Prieskumy (celoštátne)

12 % priemer 1 prieskumu · rozpätie 12–12 % · agentúr: 1

0 %10 %20 %YouGov, 11. 11. 2026: 12 %9. 11. 202610. 11. 202612. 11. 202614. 11. 202616. 11. 20260 %10 %20 %YouGov, 11. 11. 2026: 12 %9. 11. 202612. 11. 202616. 11. 2026

Bod = jeden prieskum (ukážte naň pre agentúru a dátum). Čiara = priemer posledných 5 prieskumov.

Šanca na nomináciu

12 %▲ 4 p. b.

0 %10 %20 %voľby 202629. 10. 20262. 11. 20267. 11. 202611. 11. 202616. 11. 20260 %10 %20 %voľby 202629. 10. 20267. 11. 202616. 11. 2026

Model sa prepočítava raz týždenne.

Prieskumy (celoštátne)

13 % priemer 3 prieskumov · rozpätie 9–17,9 % · agentúr: 3

0 %15 %30 %McLaughlin & Associates, 5. 11. 2026: 9 %Cygnal, 5. 11. 2026: 17,9 %YouGov, 11. 11. 2026: 12 %2. 11. 20265. 11. 20269. 11. 202612. 11. 202616. 11. 20260 %15 %30 %McLaughlin & Associates, 5. 11. 2026: 9 %Cygnal, 5. 11. 2026: 17,9 %YouGov, 11. 11. 2026: 12 %2. 11. 20269. 11. 202616. 11. 2026

Bod = jeden prieskum (ukážte naň pre agentúru a dátum). Čiara = priemer posledných 5 prieskumov.

Šanca na nomináciu

12 %▲ 5 p. b.

0 %10 %20 %voľby 202615. 10. 202623. 10. 202631. 10. 20268. 11. 202616. 11. 20260 %10 %20 %voľby 202615. 10. 202631. 10. 202616. 11. 2026

Model sa prepočítava raz týždenne.

Prieskumy (celoštátne)

13,4 % priemer 6 prieskumov · rozpätie 9–17,9 % · agentúr: 6

0 %15 %30 %Echelon Insights, 19. 10. 2026: 13 %HarrisX/Harris, 26. 10. 2026: 11 %AtlasIntel, 1. 11. 2026: 17,6 %McLaughlin & Associates, 5. 11. 2026: 9 %Cygnal, 5. 11. 2026: 17,9 %YouGov, 11. 11. 2026: 12 %17. 10. 202624. 10. 20261. 11. 20268. 11. 202616. 11. 20260 %15 %30 %Echelon Insights, 19. 10. 2026: 13 %HarrisX/Harris, 26. 10. 2026: 11 %AtlasIntel, 1. 11. 2026: 17,6 %McLaughlin & Associates, 5. 11. 2026: 9 %Cygnal, 5. 11. 2026: 17,9 %YouGov, 11. 11. 2026: 12 %17. 10. 20261. 11. 202616. 11. 2026

Bod = jeden prieskum (ukážte naň pre agentúru a dátum). Čiara = priemer posledných 5 prieskumov.

Šanca na nomináciu

12 %▲ 5 p. b.

0 %10 %20 %voľby 202613. 8. 20265. 9. 202629. 9. 202623. 10. 202616. 11. 20260 %10 %20 %voľby 202613. 8. 202629. 9. 202616. 11. 2026

Model sa prepočítava raz týždenne.

Prieskumy (celoštátne)

11,8 % priemer 11 prieskumov · rozpätie 7–17,9 % · agentúr: 7

0 %15 %30 %Echelon Insights, 17. 8. 2026: 11 %HarrisX/Harris, 30. 8. 2026: 9 %Big Data Poll, 15. 9. 2026: 10,3 %Echelon Insights, 21. 9. 2026: 7 %HarrisX/Harris, 28. 9. 2026: 12 %Echelon Insights, 19. 10. 2026: 13 %HarrisX/Harris, 26. 10. 2026: 11 %AtlasIntel, 1. 11. 2026: 17,6 %McLaughlin & Associates, 5. 11. 2026: 9 %Cygnal, 5. 11. 2026: 17,9 %YouGov, 11. 11. 2026: 12 %17. 8. 20268. 9. 20261. 10. 202624. 10. 202616. 11. 20260 %15 %30 %Echelon Insights, 17. 8. 2026: 11 %HarrisX/Harris, 30. 8. 2026: 9 %Big Data Poll, 15. 9. 2026: 10,3 %Echelon Insights, 21. 9. 2026: 7 %HarrisX/Harris, 28. 9. 2026: 12 %Echelon Insights, 19. 10. 2026: 13 %HarrisX/Harris, 26. 10. 2026: 11 %AtlasIntel, 1. 11. 2026: 17,6 %McLaughlin & Associates, 5. 11. 2026: 9 %Cygnal, 5. 11. 2026: 17,9 %YouGov, 11. 11. 2026: 12 %17. 8. 20261. 10. 202616. 11. 2026

Bod = jeden prieskum (ukážte naň pre agentúru a dátum). Čiara = priemer posledných 5 prieskumov.

Šanca na nomináciu

12 %▲ 4 p. b.

0 %10 %20 %voľby 202614. 5. 202629. 6. 202615. 8. 202630. 9. 202616. 11. 20260 %10 %20 %voľby 202614. 5. 202615. 8. 202616. 11. 2026

Model sa prepočítava raz týždenne.

Prieskumy (celoštátne)

9,9 % priemer 27 prieskumov · rozpätie 5–17,9 % · agentúr: 12

0 %15 %30 %McLaughlin & Associates, 18. 5. 2026: 7 %Echelon Insights, 18. 5. 2026: 11 %Overton Insights, 20. 5. 2026: 12 %Emerson College, 25. 5. 2026: 11,1 %Big Data Poll, 27. 5. 2026: 9 %Big Data Poll, 27. 5. 2026: 9 %TIPP Insights, 28. 5. 2026: 5 %HarrisX/Harris, 31. 5. 2026: 8 %Focaldata, 1. 6. 2026: 7 %Focaldata, 1. 6. 2026: 7 %Focaldata, 1. 6. 2026: 7 %Noble Predictive Insights, 4. 6. 2026: 8 %Echelon Insights, 14. 6. 2026: 12 %HarrisX/Harris, 12. 7. 2026: 9 %Echelon Insights, 13. 7. 2026: 9 %Noble Predictive Insights, 16. 8. 2026: 7 %Echelon Insights, 17. 8. 2026: 11 %HarrisX/Harris, 30. 8. 2026: 9 %Big Data Poll, 15. 9. 2026: 10,3 %Echelon Insights, 21. 9. 2026: 7 %HarrisX/Harris, 28. 9. 2026: 12 %Echelon Insights, 19. 10. 2026: 13 %HarrisX/Harris, 26. 10. 2026: 11 %AtlasIntel, 1. 11. 2026: 17,6 %McLaughlin & Associates, 5. 11. 2026: 9 %Cygnal, 5. 11. 2026: 17,9 %YouGov, 11. 11. 2026: 12 %18. 5. 20262. 7. 202617. 8. 20261. 10. 202616. 11. 20260 %15 %30 %McLaughlin & Associates, 18. 5. 2026: 7 %Echelon Insights, 18. 5. 2026: 11 %Overton Insights, 20. 5. 2026: 12 %Emerson College, 25. 5. 2026: 11,1 %Big Data Poll, 27. 5. 2026: 9 %Big Data Poll, 27. 5. 2026: 9 %TIPP Insights, 28. 5. 2026: 5 %HarrisX/Harris, 31. 5. 2026: 8 %Focaldata, 1. 6. 2026: 7 %Focaldata, 1. 6. 2026: 7 %Focaldata, 1. 6. 2026: 7 %Noble Predictive Insights, 4. 6. 2026: 8 %Echelon Insights, 14. 6. 2026: 12 %HarrisX/Harris, 12. 7. 2026: 9 %Echelon Insights, 13. 7. 2026: 9 %Noble Predictive Insights, 16. 8. 2026: 7 %Echelon Insights, 17. 8. 2026: 11 %HarrisX/Harris, 30. 8. 2026: 9 %Big Data Poll, 15. 9. 2026: 10,3 %Echelon Insights, 21. 9. 2026: 7 %HarrisX/Harris, 28. 9. 2026: 12 %Echelon Insights, 19. 10. 2026: 13 %HarrisX/Harris, 26. 10. 2026: 11 %AtlasIntel, 1. 11. 2026: 17,6 %McLaughlin & Associates, 5. 11. 2026: 9 %Cygnal, 5. 11. 2026: 17,9 %YouGov, 11. 11. 2026: 12 %18. 5. 202617. 8. 202616. 11. 2026

Bod = jeden prieskum (ukážte naň pre agentúru a dátum). Čiara = priemer posledných 5 prieskumov.

Šanca na nomináciu

12 %▲ 6 p. b.

0 %10 %20 %voľby 202613. 11. 202513. 2. 202616. 5. 202616. 8. 202616. 11. 20260 %10 %20 %voľby 202613. 11. 202516. 5. 202616. 11. 2026

Model sa prepočítava raz týždenne.

Prieskumy (celoštátne)

9,7 % priemer 72 prieskumov · rozpätie 2–27 % · agentúr: 23

0 %20 %40 %Echelon Insights, 17. 11. 2025: 9 %McLaughlin & Associates, 24. 11. 2025: 6 %Big Data Poll, 12. 12. 2025: 6 %Echelon Insights, 15. 12. 2025: 6 %McLaughlin & Associates, 19. 12. 2025: 6 %J.L. Partners, 19. 12. 2025: 3 %AtlasIntel, 19. 12. 2025: 16 %Zogby Analytics, 7. 1. 2026: 11 %YouGov, 14. 1. 2026: 9 %Big Data Poll, 24. 1. 2026: 6,4 %Focaldata, 26. 1. 2026: 9 %Echelon Insights, 26. 1. 2026: 9 %McLaughlin & Associates, 27. 1. 2026: 7 %TIPP Insights, 29. 1. 2026: 2 %HarrisX/Harris Poll, 29. 1. 2026: 12 %Focaldata, 10. 2. 2026: 10 %YouGov, 12. 2. 2026: 12 %Manhattan Institute, 15. 2. 2026: 7 %Manhattan Institute, 15. 2. 2026: 27 %Manhattan Institute, 15. 2. 2026: 13 %Bowling Green State University/YouGov, 18. 2. 2026: 11 %Emerson College, 22. 2. 2026: 9,1 %Echelon Insights, 23. 2. 2026: 9 %HarrisX/Harris, 26. 2. 2026: 14 %Rasmussen Reports, 27. 2. 2026: 7 %J.L. Partners, 27. 2. 2026: 7 %The Public Sentiment Institute, 28. 2. 2026: 6 %The Public Sentiment Institute, 28. 2. 2026: 6 %Noble Predictive Insights, 5. 3. 2026: 6 %McLaughlin & Associates, 9. 3. 2026: 11 %Focaldata, 10. 3. 2026: 12 %Focaldata, 10. 3. 2026: 11 %Echelon Insights, 16. 3. 2026: 11 %Yale Youth Poll, 23. 3. 2026: 13 %HarrisX/Harris, 26. 3. 2026: 8 %YouGov, 13. 4. 2026: 9 %McLaughlin & Associates, 15. 4. 2026: 4 %Echelon Insights, 20. 4. 2026: 10 %Verasight, 23. 4. 2026: 13 %HarrisX/Harris, 26. 4. 2026: 8 %Focaldata, 5. 5. 2026: 8,5 %Focaldata, 5. 5. 2026: 8,5 %AtlasIntel, 7. 5. 2026: 26 %Lake Research Partners, 11. 5. 2026: 9 %Lord Ashcroft Polls, 17. 5. 2026: 9 %McLaughlin & Associates, 18. 5. 2026: 7 %Echelon Insights, 18. 5. 2026: 11 %Overton Insights, 20. 5. 2026: 12 %Emerson College, 25. 5. 2026: 11,1 %Big Data Poll, 27. 5. 2026: 9 %Big Data Poll, 27. 5. 2026: 9 %TIPP Insights, 28. 5. 2026: 5 %HarrisX/Harris, 31. 5. 2026: 8 %Focaldata, 1. 6. 2026: 7 %Focaldata, 1. 6. 2026: 7 %Focaldata, 1. 6. 2026: 7 %Noble Predictive Insights, 4. 6. 2026: 8 %Echelon Insights, 14. 6. 2026: 12 %HarrisX/Harris, 12. 7. 2026: 9 %Echelon Insights, 13. 7. 2026: 9 %Noble Predictive Insights, 16. 8. 2026: 7 %Echelon Insights, 17. 8. 2026: 11 %HarrisX/Harris, 30. 8. 2026: 9 %Big Data Poll, 15. 9. 2026: 10,3 %Echelon Insights, 21. 9. 2026: 7 %HarrisX/Harris, 28. 9. 2026: 12 %Echelon Insights, 19. 10. 2026: 13 %HarrisX/Harris, 26. 10. 2026: 11 %AtlasIntel, 1. 11. 2026: 17,6 %McLaughlin & Associates, 5. 11. 2026: 9 %Cygnal, 5. 11. 2026: 17,9 %YouGov, 11. 11. 2026: 12 %16. 11. 202515. 2. 202617. 5. 202616. 8. 202616. 11. 20260 %20 %40 %Echelon Insights, 17. 11. 2025: 9 %McLaughlin & Associates, 24. 11. 2025: 6 %Big Data Poll, 12. 12. 2025: 6 %Echelon Insights, 15. 12. 2025: 6 %McLaughlin & Associates, 19. 12. 2025: 6 %J.L. Partners, 19. 12. 2025: 3 %AtlasIntel, 19. 12. 2025: 16 %Zogby Analytics, 7. 1. 2026: 11 %YouGov, 14. 1. 2026: 9 %Big Data Poll, 24. 1. 2026: 6,4 %Focaldata, 26. 1. 2026: 9 %Echelon Insights, 26. 1. 2026: 9 %McLaughlin & Associates, 27. 1. 2026: 7 %TIPP Insights, 29. 1. 2026: 2 %HarrisX/Harris Poll, 29. 1. 2026: 12 %Focaldata, 10. 2. 2026: 10 %YouGov, 12. 2. 2026: 12 %Manhattan Institute, 15. 2. 2026: 7 %Manhattan Institute, 15. 2. 2026: 27 %Manhattan Institute, 15. 2. 2026: 13 %Bowling Green State University/YouGov, 18. 2. 2026: 11 %Emerson College, 22. 2. 2026: 9,1 %Echelon Insights, 23. 2. 2026: 9 %HarrisX/Harris, 26. 2. 2026: 14 %Rasmussen Reports, 27. 2. 2026: 7 %J.L. Partners, 27. 2. 2026: 7 %The Public Sentiment Institute, 28. 2. 2026: 6 %The Public Sentiment Institute, 28. 2. 2026: 6 %Noble Predictive Insights, 5. 3. 2026: 6 %McLaughlin & Associates, 9. 3. 2026: 11 %Focaldata, 10. 3. 2026: 12 %Focaldata, 10. 3. 2026: 11 %Echelon Insights, 16. 3. 2026: 11 %Yale Youth Poll, 23. 3. 2026: 13 %HarrisX/Harris, 26. 3. 2026: 8 %YouGov, 13. 4. 2026: 9 %McLaughlin & Associates, 15. 4. 2026: 4 %Echelon Insights, 20. 4. 2026: 10 %Verasight, 23. 4. 2026: 13 %HarrisX/Harris, 26. 4. 2026: 8 %Focaldata, 5. 5. 2026: 8,5 %Focaldata, 5. 5. 2026: 8,5 %AtlasIntel, 7. 5. 2026: 26 %Lake Research Partners, 11. 5. 2026: 9 %Lord Ashcroft Polls, 17. 5. 2026: 9 %McLaughlin & Associates, 18. 5. 2026: 7 %Echelon Insights, 18. 5. 2026: 11 %Overton Insights, 20. 5. 2026: 12 %Emerson College, 25. 5. 2026: 11,1 %Big Data Poll, 27. 5. 2026: 9 %Big Data Poll, 27. 5. 2026: 9 %TIPP Insights, 28. 5. 2026: 5 %HarrisX/Harris, 31. 5. 2026: 8 %Focaldata, 1. 6. 2026: 7 %Focaldata, 1. 6. 2026: 7 %Focaldata, 1. 6. 2026: 7 %Noble Predictive Insights, 4. 6. 2026: 8 %Echelon Insights, 14. 6. 2026: 12 %HarrisX/Harris, 12. 7. 2026: 9 %Echelon Insights, 13. 7. 2026: 9 %Noble Predictive Insights, 16. 8. 2026: 7 %Echelon Insights, 17. 8. 2026: 11 %HarrisX/Harris, 30. 8. 2026: 9 %Big Data Poll, 15. 9. 2026: 10,3 %Echelon Insights, 21. 9. 2026: 7 %HarrisX/Harris, 28. 9. 2026: 12 %Echelon Insights, 19. 10. 2026: 13 %HarrisX/Harris, 26. 10. 2026: 11 %AtlasIntel, 1. 11. 2026: 17,6 %McLaughlin & Associates, 5. 11. 2026: 9 %Cygnal, 5. 11. 2026: 17,9 %YouGov, 11. 11. 2026: 12 %16. 11. 202517. 5. 202616. 11. 2026

Bod = jeden prieskum (ukážte naň pre agentúru a dátum). Čiara = priemer posledných 5 prieskumov.

Šanca na nomináciu

12 %

0 %10 %20 %voľby 202616. 1. 20252. 7. 202516. 12. 20251. 6. 202616. 11. 20260 %10 %20 %voľby 202616. 1. 202516. 12. 202516. 11. 2026

Model sa prepočítava raz týždenne.

Prieskumy (celoštátne)

8,9 % priemer 123 prieskumov · rozpätie 0,9–27 % · agentúr: 30

0 %20 %40 %Morning Consult, 17. 11. 2024: 4 %Echelon Insights, 18. 11. 2024: 4 %Emerson College, 22. 11. 2024: 0,9 %McLaughlin & Associates, 16. 12. 2024: 3 %McLaughlin & Associates, 27. 1. 2025: 6 %J.L. Partners, 3. 2. 2025: 5 %Echelon Insights, 13. 2. 2025: 5 %McLaughlin & Associates, 18. 2. 2025: 3 %Echelon Insights, 13. 3. 2025: 7 %Morning Consult, 16. 3. 2025: 5 %Targoz Market Research, 28. 3. 2025: 15 %YouGov, 1. 4. 2025: 8 %Yale University Institution for Social and Policy Studies, 3. 4. 2025: 21,3 %Echelon Insights, 14. 4. 2025: 7 %Data for Progress, 14. 4. 2025: 12 %AtlasIntel, 14. 4. 2025: 15,9 %YouGov, 23. 4. 2025: 7 %YouGov, 23. 4. 2025: 7 %Quantus Insights, 23. 4. 2025: 14 %McLaughlin & Associates, 29. 4. 2025: 8 %Echelon Insights, 12. 5. 2025: 8 %J.L. Partners, 14. 5. 2025: 6 %McLaughlin & Associates, 26. 5. 2025: 9 %AtlasIntel, 27. 5. 2025: 19,4 %Morning Consult, 15. 6. 2025: 7 %McLaughlin & Associates, 15. 6. 2025: 7 %Emerson College, 25. 6. 2025: 7,1 %Targoz Market Research, 26. 6. 2025: 7 %Targoz Market Research, 26. 6. 2025: 7 %McLaughlin & Associates, 14. 7. 2025: 9 %Echelon Insights, 14. 7. 2025: 6 %YouGov, 21. 7. 2025: 10 %Echelon Insights, 18. 8. 2025: 6 %Morning Consult, 24. 8. 2025: 6 %McLaughlin & Associates, 26. 8. 2025: 4 %Emerson College, 26. 8. 2025: 4,1 %Leger, 31. 8. 2025: 10 %YouGov, 2. 9. 2025: 12 %YouGov, 8. 9. 2025: 8 %AtlasIntel, 16. 9. 2025: 10,8 %McLaughlin & Associates, 22. 9. 2025: 5 %Echelon Insights, 22. 9. 2025: 7 %Leger, 29. 9. 2025: 9 %Noble Predictive Insights, 6. 10. 2025: 8 %Echelon Insights, 20. 10. 2025: 4 %McLaughlin & Associates, 27. 10. 2025: 4 %Overton Insights/Targoz Market Research, 29. 10. 2025: 7 %Emerson College, 4. 11. 2025: 2,8 %YouGov, 9. 11. 2025: 6 %Morning Consult, 9. 11. 2025: 7 %Yale Youth Poll, 11. 11. 2025: 16 %Echelon Insights, 17. 11. 2025: 9 %McLaughlin & Associates, 24. 11. 2025: 6 %Big Data Poll, 12. 12. 2025: 6 %Echelon Insights, 15. 12. 2025: 6 %McLaughlin & Associates, 19. 12. 2025: 6 %J.L. Partners, 19. 12. 2025: 3 %AtlasIntel, 19. 12. 2025: 16 %Zogby Analytics, 7. 1. 2026: 11 %YouGov, 14. 1. 2026: 9 %Big Data Poll, 24. 1. 2026: 6,4 %Focaldata, 26. 1. 2026: 9 %Echelon Insights, 26. 1. 2026: 9 %McLaughlin & Associates, 27. 1. 2026: 7 %TIPP Insights, 29. 1. 2026: 2 %HarrisX/Harris Poll, 29. 1. 2026: 12 %Focaldata, 10. 2. 2026: 10 %YouGov, 12. 2. 2026: 12 %Manhattan Institute, 15. 2. 2026: 7 %Manhattan Institute, 15. 2. 2026: 27 %Manhattan Institute, 15. 2. 2026: 13 %Bowling Green State University/YouGov, 18. 2. 2026: 11 %Emerson College, 22. 2. 2026: 9,1 %Echelon Insights, 23. 2. 2026: 9 %HarrisX/Harris, 26. 2. 2026: 14 %Rasmussen Reports, 27. 2. 2026: 7 %J.L. Partners, 27. 2. 2026: 7 %The Public Sentiment Institute, 28. 2. 2026: 6 %The Public Sentiment Institute, 28. 2. 2026: 6 %Noble Predictive Insights, 5. 3. 2026: 6 %McLaughlin & Associates, 9. 3. 2026: 11 %Focaldata, 10. 3. 2026: 12 %Focaldata, 10. 3. 2026: 11 %Echelon Insights, 16. 3. 2026: 11 %Yale Youth Poll, 23. 3. 2026: 13 %HarrisX/Harris, 26. 3. 2026: 8 %YouGov, 13. 4. 2026: 9 %McLaughlin & Associates, 15. 4. 2026: 4 %Echelon Insights, 20. 4. 2026: 10 %Verasight, 23. 4. 2026: 13 %HarrisX/Harris, 26. 4. 2026: 8 %Focaldata, 5. 5. 2026: 8,5 %Focaldata, 5. 5. 2026: 8,5 %AtlasIntel, 7. 5. 2026: 26 %Lake Research Partners, 11. 5. 2026: 9 %Lord Ashcroft Polls, 17. 5. 2026: 9 %McLaughlin & Associates, 18. 5. 2026: 7 %Echelon Insights, 18. 5. 2026: 11 %Overton Insights, 20. 5. 2026: 12 %Emerson College, 25. 5. 2026: 11,1 %Big Data Poll, 27. 5. 2026: 9 %Big Data Poll, 27. 5. 2026: 9 %TIPP Insights, 28. 5. 2026: 5 %HarrisX/Harris, 31. 5. 2026: 8 %Focaldata, 1. 6. 2026: 7 %Focaldata, 1. 6. 2026: 7 %Focaldata, 1. 6. 2026: 7 %Noble Predictive Insights, 4. 6. 2026: 8 %Echelon Insights, 14. 6. 2026: 12 %HarrisX/Harris, 12. 7. 2026: 9 %Echelon Insights, 13. 7. 2026: 9 %Noble Predictive Insights, 16. 8. 2026: 7 %Echelon Insights, 17. 8. 2026: 11 %HarrisX/Harris, 30. 8. 2026: 9 %Big Data Poll, 15. 9. 2026: 10,3 %Echelon Insights, 21. 9. 2026: 7 %HarrisX/Harris, 28. 9. 2026: 12 %Echelon Insights, 19. 10. 2026: 13 %HarrisX/Harris, 26. 10. 2026: 11 %AtlasIntel, 1. 11. 2026: 17,6 %McLaughlin & Associates, 5. 11. 2026: 9 %Cygnal, 5. 11. 2026: 17,9 %YouGov, 11. 11. 2026: 12 %14. 11. 202416. 5. 202515. 11. 202517. 5. 202616. 11. 20260 %20 %40 %Morning Consult, 17. 11. 2024: 4 %Echelon Insights, 18. 11. 2024: 4 %Emerson College, 22. 11. 2024: 0,9 %McLaughlin & Associates, 16. 12. 2024: 3 %McLaughlin & Associates, 27. 1. 2025: 6 %J.L. Partners, 3. 2. 2025: 5 %Echelon Insights, 13. 2. 2025: 5 %McLaughlin & Associates, 18. 2. 2025: 3 %Echelon Insights, 13. 3. 2025: 7 %Morning Consult, 16. 3. 2025: 5 %Targoz Market Research, 28. 3. 2025: 15 %YouGov, 1. 4. 2025: 8 %Yale University Institution for Social and Policy Studies, 3. 4. 2025: 21,3 %Echelon Insights, 14. 4. 2025: 7 %Data for Progress, 14. 4. 2025: 12 %AtlasIntel, 14. 4. 2025: 15,9 %YouGov, 23. 4. 2025: 7 %YouGov, 23. 4. 2025: 7 %Quantus Insights, 23. 4. 2025: 14 %McLaughlin & Associates, 29. 4. 2025: 8 %Echelon Insights, 12. 5. 2025: 8 %J.L. Partners, 14. 5. 2025: 6 %McLaughlin & Associates, 26. 5. 2025: 9 %AtlasIntel, 27. 5. 2025: 19,4 %Morning Consult, 15. 6. 2025: 7 %McLaughlin & Associates, 15. 6. 2025: 7 %Emerson College, 25. 6. 2025: 7,1 %Targoz Market Research, 26. 6. 2025: 7 %Targoz Market Research, 26. 6. 2025: 7 %McLaughlin & Associates, 14. 7. 2025: 9 %Echelon Insights, 14. 7. 2025: 6 %YouGov, 21. 7. 2025: 10 %Echelon Insights, 18. 8. 2025: 6 %Morning Consult, 24. 8. 2025: 6 %McLaughlin & Associates, 26. 8. 2025: 4 %Emerson College, 26. 8. 2025: 4,1 %Leger, 31. 8. 2025: 10 %YouGov, 2. 9. 2025: 12 %YouGov, 8. 9. 2025: 8 %AtlasIntel, 16. 9. 2025: 10,8 %McLaughlin & Associates, 22. 9. 2025: 5 %Echelon Insights, 22. 9. 2025: 7 %Leger, 29. 9. 2025: 9 %Noble Predictive Insights, 6. 10. 2025: 8 %Echelon Insights, 20. 10. 2025: 4 %McLaughlin & Associates, 27. 10. 2025: 4 %Overton Insights/Targoz Market Research, 29. 10. 2025: 7 %Emerson College, 4. 11. 2025: 2,8 %YouGov, 9. 11. 2025: 6 %Morning Consult, 9. 11. 2025: 7 %Yale Youth Poll, 11. 11. 2025: 16 %Echelon Insights, 17. 11. 2025: 9 %McLaughlin & Associates, 24. 11. 2025: 6 %Big Data Poll, 12. 12. 2025: 6 %Echelon Insights, 15. 12. 2025: 6 %McLaughlin & Associates, 19. 12. 2025: 6 %J.L. Partners, 19. 12. 2025: 3 %AtlasIntel, 19. 12. 2025: 16 %Zogby Analytics, 7. 1. 2026: 11 %YouGov, 14. 1. 2026: 9 %Big Data Poll, 24. 1. 2026: 6,4 %Focaldata, 26. 1. 2026: 9 %Echelon Insights, 26. 1. 2026: 9 %McLaughlin & Associates, 27. 1. 2026: 7 %TIPP Insights, 29. 1. 2026: 2 %HarrisX/Harris Poll, 29. 1. 2026: 12 %Focaldata, 10. 2. 2026: 10 %YouGov, 12. 2. 2026: 12 %Manhattan Institute, 15. 2. 2026: 7 %Manhattan Institute, 15. 2. 2026: 27 %Manhattan Institute, 15. 2. 2026: 13 %Bowling Green State University/YouGov, 18. 2. 2026: 11 %Emerson College, 22. 2. 2026: 9,1 %Echelon Insights, 23. 2. 2026: 9 %HarrisX/Harris, 26. 2. 2026: 14 %Rasmussen Reports, 27. 2. 2026: 7 %J.L. Partners, 27. 2. 2026: 7 %The Public Sentiment Institute, 28. 2. 2026: 6 %The Public Sentiment Institute, 28. 2. 2026: 6 %Noble Predictive Insights, 5. 3. 2026: 6 %McLaughlin & Associates, 9. 3. 2026: 11 %Focaldata, 10. 3. 2026: 12 %Focaldata, 10. 3. 2026: 11 %Echelon Insights, 16. 3. 2026: 11 %Yale Youth Poll, 23. 3. 2026: 13 %HarrisX/Harris, 26. 3. 2026: 8 %YouGov, 13. 4. 2026: 9 %McLaughlin & Associates, 15. 4. 2026: 4 %Echelon Insights, 20. 4. 2026: 10 %Verasight, 23. 4. 2026: 13 %HarrisX/Harris, 26. 4. 2026: 8 %Focaldata, 5. 5. 2026: 8,5 %Focaldata, 5. 5. 2026: 8,5 %AtlasIntel, 7. 5. 2026: 26 %Lake Research Partners, 11. 5. 2026: 9 %Lord Ashcroft Polls, 17. 5. 2026: 9 %McLaughlin & Associates, 18. 5. 2026: 7 %Echelon Insights, 18. 5. 2026: 11 %Overton Insights, 20. 5. 2026: 12 %Emerson College, 25. 5. 2026: 11,1 %Big Data Poll, 27. 5. 2026: 9 %Big Data Poll, 27. 5. 2026: 9 %TIPP Insights, 28. 5. 2026: 5 %HarrisX/Harris, 31. 5. 2026: 8 %Focaldata, 1. 6. 2026: 7 %Focaldata, 1. 6. 2026: 7 %Focaldata, 1. 6. 2026: 7 %Noble Predictive Insights, 4. 6. 2026: 8 %Echelon Insights, 14. 6. 2026: 12 %HarrisX/Harris, 12. 7. 2026: 9 %Echelon Insights, 13. 7. 2026: 9 %Noble Predictive Insights, 16. 8. 2026: 7 %Echelon Insights, 17. 8. 2026: 11 %HarrisX/Harris, 30. 8. 2026: 9 %Big Data Poll, 15. 9. 2026: 10,3 %Echelon Insights, 21. 9. 2026: 7 %HarrisX/Harris, 28. 9. 2026: 12 %Echelon Insights, 19. 10. 2026: 13 %HarrisX/Harris, 26. 10. 2026: 11 %AtlasIntel, 1. 11. 2026: 17,6 %McLaughlin & Associates, 5. 11. 2026: 9 %Cygnal, 5. 11. 2026: 17,9 %YouGov, 11. 11. 2026: 12 %14. 11. 202415. 11. 202516. 11. 2026

Bod = jeden prieskum (ukážte naň pre agentúru a dátum). Čiara = priemer posledných 5 prieskumov.

Ako sa agentúry rozchádzajú

Alexandria Ocasio-Cortez

12 agentúr · od 5 po 17,9 %

0 %15 %30 %TIPP Insights, 2026-05-28: 5 %Noble Predictive Insights, 2026-08-16: 7 %Focaldata, 2026-06-01: 7 %McLaughlin & Associates, 2026-11-05: 9 %Big Data Poll, 2026-09-15: 10,3 %HarrisX/Harris, 2026-10-26: 11 %Emerson College, 2026-05-25: 11,1 %YouGov, 2026-11-11: 12 %Overton Insights, 2026-05-20: 12 %Echelon Insights, 2026-10-19: 13 %AtlasIntel, 2026-11-01: 17,6 %Cygnal, 2026-11-05: 17,9 %

5 TIPP7 Noble7 Focaldata9 McLaughlin10,3 Big Data11 HarrisX11,1 Emerson12 YouGov12 Overton13 Echelon17,6 AtlasIntel17,9 Cygnal

Priemer agentúr 11,1 % (červená čiarka). Model používa vážený priemer, preto sa môže líšiť.

V správach

Všetky správy

Verejné funkcie

  1. 2019–dodnesU.S. Representative, New York Voteview

Vzdelanie

Boston Universitygovinfo.gov

Rok narodenia: 1989govinfo.gov. Zdroje: Voteview (UCLA) pre Kongres; ostatné funkcie, vzdelanie a rok narodenia z oficiálnych stránok úradov (odkaz pri každom údaji).

Hlasovania v Kongrese

Umiernenejšie než 7 z 10 demokratov v dnešnom Kongrese (2025–2027).

väčšina demokratovväčšina republikánovAbigail SpanbergerAmy KlobucharBernie SandersBeto O'RourkeChris MurphyChris Van HollenCory BookerElise StefanikElizabeth WarrenHakeem JeffriesJared PolisJasmine CrockettJD VanceJohn FettermanJohn KennedyJon OssoffJosh HawleyKamala HarrisKatie BrittKristi NoemLee ZeldinMarco RubioMarjorie Taylor GreeneMark KellyMike PenceMike PompeoRahm EmanuelRand PaulRaphael WarnockRashida TlaibRick ScottRo KhannaRon DeSantisRuben GallegoSean DuffyTed CruzThomas MassieTim ScottTim WalzTom CottonTulsi GabbardAlexandria Ocasio-CortezOcasio-Cortez← liberálnejšiekonzervatívnejšie →

Pásma ukazujú, kde hlasuje stredných 80 % členov každej strany v dnešnom Kongrese. Podľa 3 288 hlasovaní; skóre -0,333 na škále od −1 po +1 (metóda DW-NOMINATE, Voteview).

Meria, s kým človek v Kongrese hlasuje, nie čo hovorí. Kto hlasuje proti vlastnej strane zľava (napríklad progresívci proti kompromisným zákonom), môže na škále vyzerať umiernenejšie.

Peniaze na kampaň 2028

Zatiaľ bez registrovanej prezidentskej kampane pri Federal Election Commission. Keď ju zaregistruje, sumy sa tu objavia automaticky.

Postoje a témy

  • Jej prvým návrhom zákona bol Green New Deal: prechod energetiky na obnoviteľné zdroje a nové pracovné miesta. ocasio-cortez.house.gov
  • Podporuje Medicare for All, teda jednotné verejné zdravotné poistenie pre všetkých bez ohľadu na príjem či zamestnanie. ocasio-cortez.house.gov
  • Bývanie: obnova verejných bytov, obmedzenie zvyšovania nájmov a ťažšie vysťahovanie nájomníkov (Place to Prosper Act). ocasio-cortez.house.gov
  • Odmieta zákon „One Big Beautiful Bill Act“, ktorý podľa nej prináša drastické škrty v zdravotníctve, potravinovej pomoci a študentských pôžičkách. ocasio-cortez.house.gov
  • Kritizuje zásahy imigračnej polície ICE a podporuje dočasnú ochranu (TPS) pre migrantov z Ekvádoru. ocasio-cortez.house.gov

Prieskumy

AgentúraKoniec zberuOcasio-CortezVzorkaZdroj
YouGov11. 11. 202612 %489 Azverejnenie
McLaughlin & Associates5. 11. 20269 %471 LVzverejnenie
Cygnal5. 11. 202617,9 %1 398 LVzverejnenie
AtlasIntel1. 11. 202617,6 %–zverejnenie
HarrisX/Harris26. 10. 202611 %–zverejnenie
Echelon Insights19. 10. 202613 %522 LVzverejnenie
HarrisX/Harris28. 9. 202612 %–zverejnenie
Echelon Insights21. 9. 20267 %491 LVzverejnenie
Big Data Poll15. 9. 202610,3 %1 329 LVzverejnenie
HarrisX/Harris30. 8. 20269 %–zverejnenie
Echelon Insights17. 8. 202611 %483 LVzverejnenie
Noble Predictive Insights16. 8. 20267 %930 RVzverejnenie
Echelon Insights13. 7. 20269 %496 LVzverejnenie
HarrisX/Harris12. 7. 20269 %–zverejnenie
Echelon Insights14. 6. 202612 %467 LVzverejnenie
Noble Predictive Insights4. 6. 20268 %1 224 RVzverejnenie
Focaldata1. 6. 20267 %657 RVzverejnenie
Focaldata1. 6. 20267 %646 LVzverejnenie
Focaldata1. 6. 20267 %685 Azverejnenie
HarrisX/Harris31. 5. 20268 %–zverejnenie
TIPP Insights28. 5. 20265 %593 RVzverejnenie
Big Data Poll27. 5. 20269 %1 467 RVzverejnenie
Big Data Poll27. 5. 20269 %1 378 LVzverejnenie
Emerson College25. 5. 202611,1 %432 LVzverejnenie
Overton Insights20. 5. 202612 %–zverejnenie
Pre médiáGrafy na vloženieDáta na stiahnutieKalendár primárokKomentár pre médiá